
|
|
|
|
Augusta FC
Cash Bids
Market Data
News
Ag Commentary
Weather
Resources
|

Fibonacci, It Is In Every Market, New Video
Grains Corn bottomed at a 78.6% retracement, Soybeans at a 61.8% retracement and Wheat made its bottom at a 78.6% retracement. Tesla bottomed at 78.6%, COIN topped at a 61.8% retracement and Lean Hogs were stopped by 61.8% and then by the Bull market end at 78.6% on 4/23/24. There are a few basic rules when using the Fibonacci retracements with the ONE44 rules and guidelines. This is the short version. A 38.2% level keeps the trend intact and new highs/lows should follow. A 23.6% level shows the market is extremely strong, or weak. A 61.8% level can cause wide swings and keep the market in a trading range. A 78.6% level can send it 78.6% of where it just came from and even be the end or start of a Bull market. We have done 40 videos on how to use the Fibonacci retracements with the ONE44 rules and guidelines.  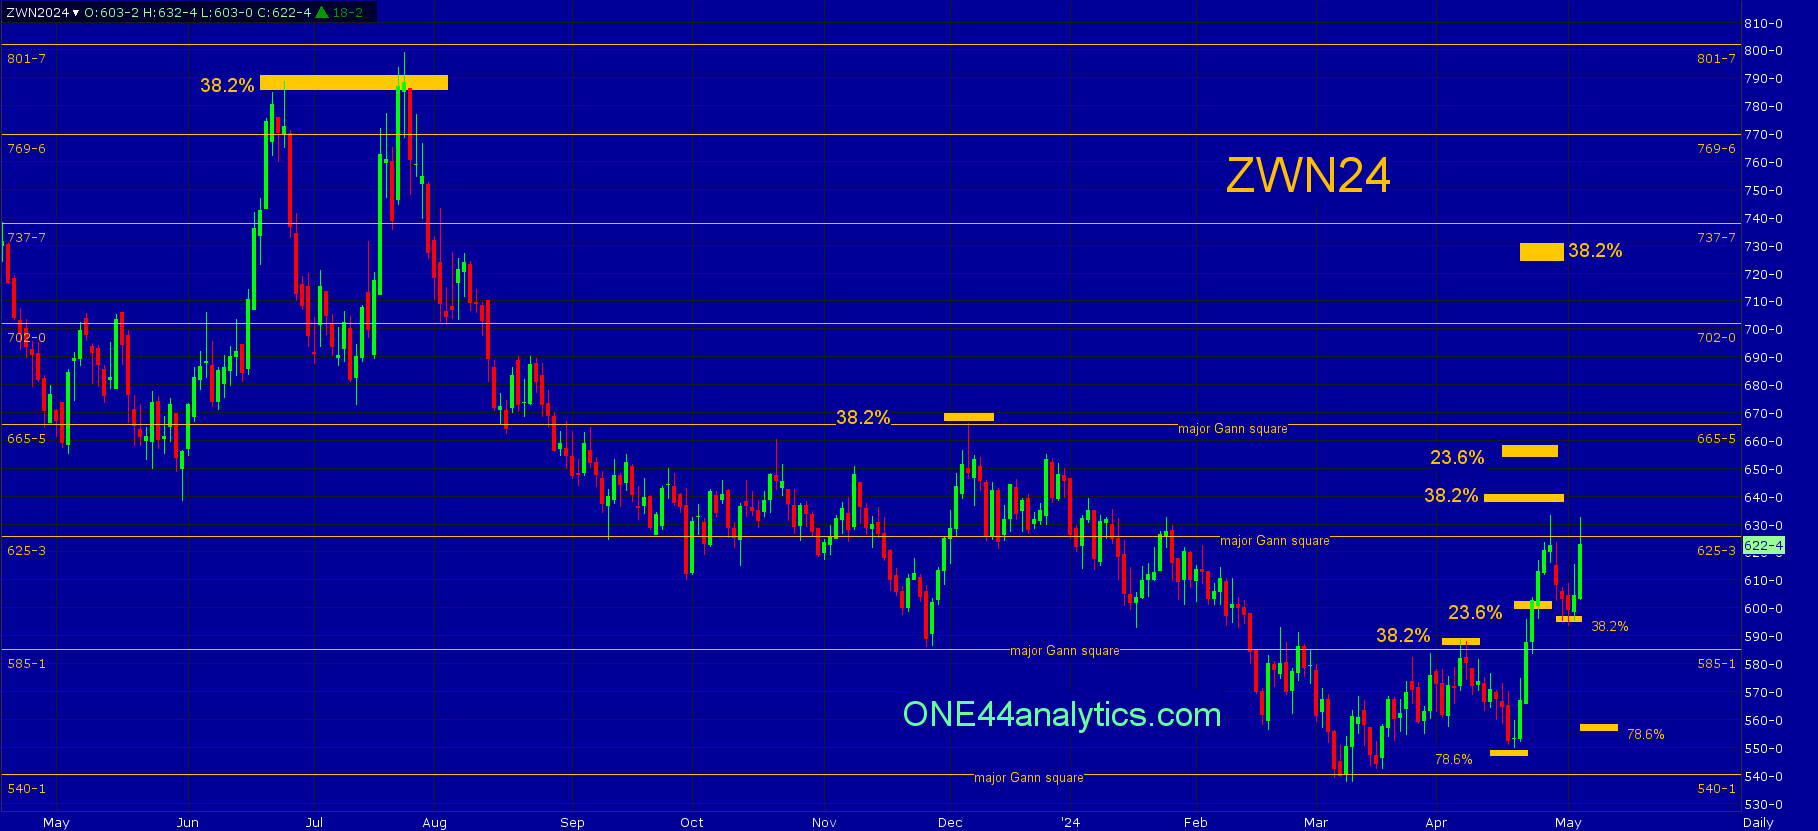 ONE44 Analytics where the analysis is concise and to the point Our goal is to not only give you actionable information, but to help you understand why we think this is happening based on pure price analysis with Fibonacci retracements, that we believe are the underlying structure of all markets and Gann squares. If you like this type of analysis and trade the Grain/Livestock futures you can become a Premium Member. You can also follow us on YouTube for more examples of how to use the Fibonacci retracements with the ONE44 rules and guidelines. Sign up for our Free newsletter here. FULL RISK DISCLOSURE: Futures trading contains substantial risk and is not for every investor. An investor could potentially lose all or more than the initial investment. Commission Rule 4.41(b)(1)(I) hypothetical or simulated performance results have certain inherent limitations. Unlike an actual performance record, simulated results do not represent actual trading. Also, since the trades have not actually been executed, the results may have under- or over-compensated for the impact, if any, of certain market factors, such as lack of liquidity. Simulated trading programs in general are also subject to the fact that they are designed with the benefit of hindsight. No representation is being made that any account will or is likely to achieve profits or losses similar to those shown. Past performance is not necessarily indicative of future results. On the date of publication, Nick Ehrenberg did not have (either directly or indirectly) positions in any of the securities mentioned in this article. All information and data in this article is solely for informational purposes. For more information please view the Barchart Disclosure Policy here. |
|
|